Designer
Report Designer
Application development with BIRT starts with the report designer. This Eclipse-based set of plug-ins offers a variety of tools to build reports quickly. Some of these are listed below.
Data Explorer - Organizes your data sources (connections) and data sets (queries). The data set editor allows you to test your data set to ensure the report receives the correct data. Within this view multi dimensional cubes can be created using existing data sets. Cubes are currently used when building dynamic cross tables. This view also is used to design report parameters.
Navigator - Shows the projects and files that are in your workspace. You can also create projects, designs, and other BIRT files here.
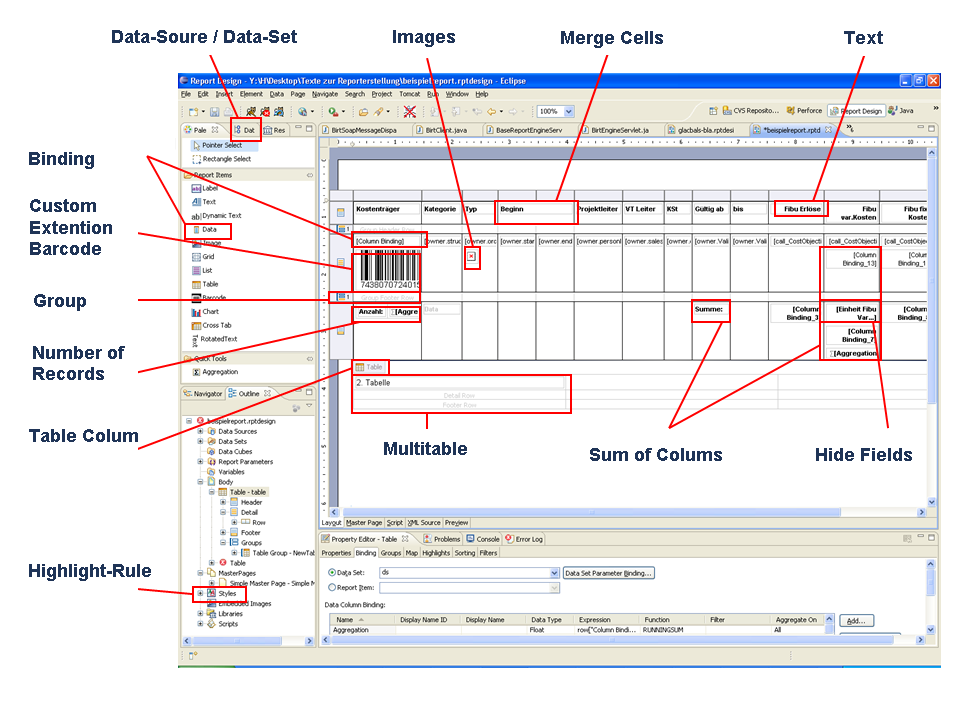
Layout View - WYSIWYG editor that provides drag & drop creation of the presentation portion of your report.
Palette - Contains the standard BIRT report elements such as labels, tables, and charts and is used in conjunction with the Layout View to design reports.
Property Editor - Presents the most commonly used properties in a convenient format that makes editing quick and easy. BIRT also integrates with the standard Eclipse property view to provide a detailed listing of all properties for an item.
- Script Editor - Scripting adds business logic to reports during data access, during report generation, or during viewing. The code editor provides standard Eclipse features for editing your scripts: syntax coloring, auto-complete and more. An interesting new feature, for BIRT 2.3 is the ability to debug scripts while the report is running.
- Outline - BIRT reports are organized as a tree structure with the overall report as the root, and separate categories for styles, report content, data sources, data sets, report parameters and more. The Outline view provides a compact overview of your entire report structure.
Cheat Sheets - Learning a new tool is always a challenge, but Eclipse offers an innovative solution: cheat sheets. These are short bits of documentation that walk you through new tasks.
Resource Explorer - BIRT allows the reuse of report objects, such as tables, data sources and styles. Objects created for reuse are stored in a library file. To browse the contents of report libraries BIRT supplies a Resource Explorer view. This view list all libraries within the resource folder, in addition other shared content such as images and JavaScript files.
Chart Builder - Adding Charts to BIRT designs is expedited with the Chart Builder. Chart creation is separated into three phases: Select Chart Type, Select Data, and Format Chart.
Expression Builder - BIRT expressions are really just simple scripts that return a value. Expressions are used for assigning data values to report elements, building image locations, hyperlinks, parameter default values and many other places. Expressions are constructed within BIRT using the Expression Builder.