Design
With BIRT, you can add a rich variety of reports to your application. Find a few examples below:
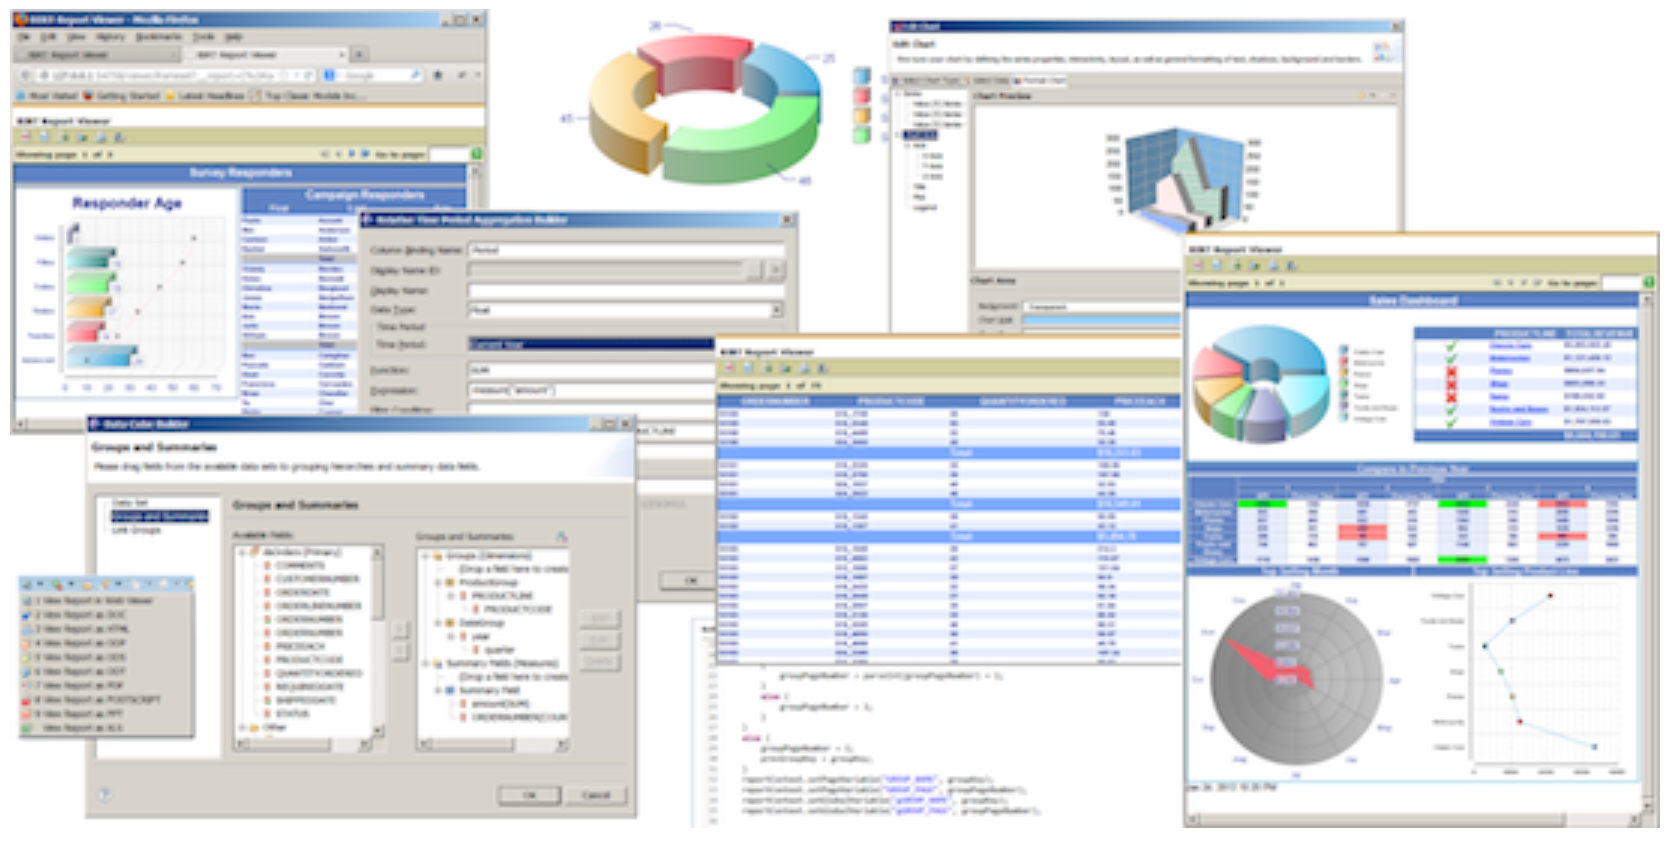
Reports can go from simple lists to highly complex BI or dashboards. Find some typical applications below:
Lists - The simplest reports are lists of data. As the lists get longer, you can add grouping to organize related data together (orders grouped by customer, products grouped by supplier). If your data is numeric, you can easily add totals, averages and other summaries.
Charts - Numeric data is much easier to understand when presented as a chart. BIRT provides pie charts, line & bar charts and many more. BIRT charts can be rendered in SVG and support events to allow user interaction.
Crosstabs - Crosstabs (also called a cross-tabulation or matrix) shows data in two dimensions: sales per quarter or hits per web page.
Letters & Documents - Notices, form letters, and other textual documents are easy to create with BIRT. Documents can include text, formatting, lists, charts and more.
Compound Reports - Many reports need to combine the above into a single document. For example, a customer statement may list the information for the customer, provide text about current promotions, and provide side-by-side lists of payments and charges. A financial report may include disclaimers, charts, tables all with extensive formatting that matches corporate color schemes.